Plot alocation with QGIS
With the FPT Plot Allocation Plugin, you will be able to allocate inventory plots using various sampling methods and plot shapes, all through a user-friendly and intuitive graphical interface.
Plugin instalation
Within QGIS, go to "Plugins" "Manage and Install Plugins" and search for "FPT Plot Allocation".
Installation via zip file
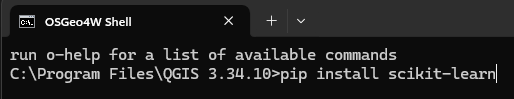
If you prefer, click here to download the ZIP file containing the plugin files. For more information about installation, see the QGIS plugins installation guide.
Plugin Interface
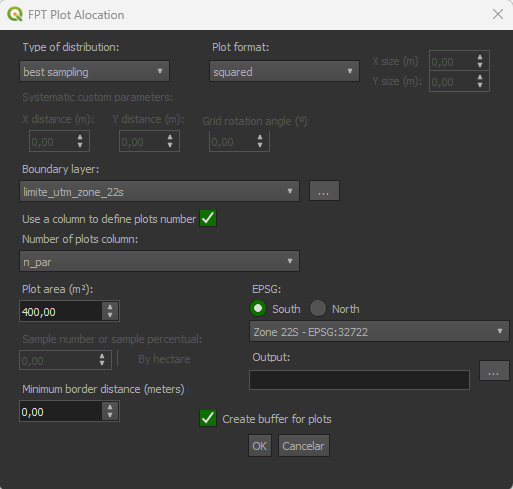
Plugin Basics
| Parameters | Description |
|---|---|
| Type of distribution | Type of distribution of the plots. |
| Plot format | Format of the plot you want to install. |
| Boundary layer | The shapefile with the polygon of the area. |
| Use a column to define plots number | If selected, allows the user to choose a column to define the number of plots per polygon. |
| Plot area | Area in square meters that each plot will have. |
| Sample numbers or sample percentage | Could be the number of plots or the percentage of the total area that will be sampled. If value < 1 it will be understood as a percentage. If value >= 1 it will be understood that you are setting the quantity of plots to allocate. |
| By hectare | If selected, applies the value of Sample numbers or sample percentage per hectare. The value must be greater than 1. |
| Minimum border distance (meters) | (Optional) Defines the minimum distance in meters that each plot will have from the border. |
| EPSG | The EPSG of your area. |
| Create buffer for plots | (Optional) If checked, will create a buffer showing the area of the plots. |
| Output | (Optional) Select a folder to save your plots shapefile. |
Available arguments
random: Allocate the plots in a random distributionbest sampling: (recommended) Allocate the plots in the best possible distribution for the area considering the established parameters.systematic: Allocate the plots in a grid distribution, does not allow the definition ofsample number or sample percentageand alocate all possible plots.systematic custom: Allocate the plots in a grid distribution with thexandydistances from the grid lines andgrid rotation angledefined by the user.
round: Consider that plots will have a rounded shape.squared: Consider that plots will have a squared shape.rectangle: Allows user to insert the X and Y sizes of the desired rectangle shape.
- In order to achieve the best precision in calculation, you must select the UTM zone that your area is in. Find your utm zone.